Why?
Quick answer is that we did not find any java profiler with reasonable price, active development / support and human-friendly profiling results delivery. Check our User Guide for more explanations.
What exactly is hoopoe?
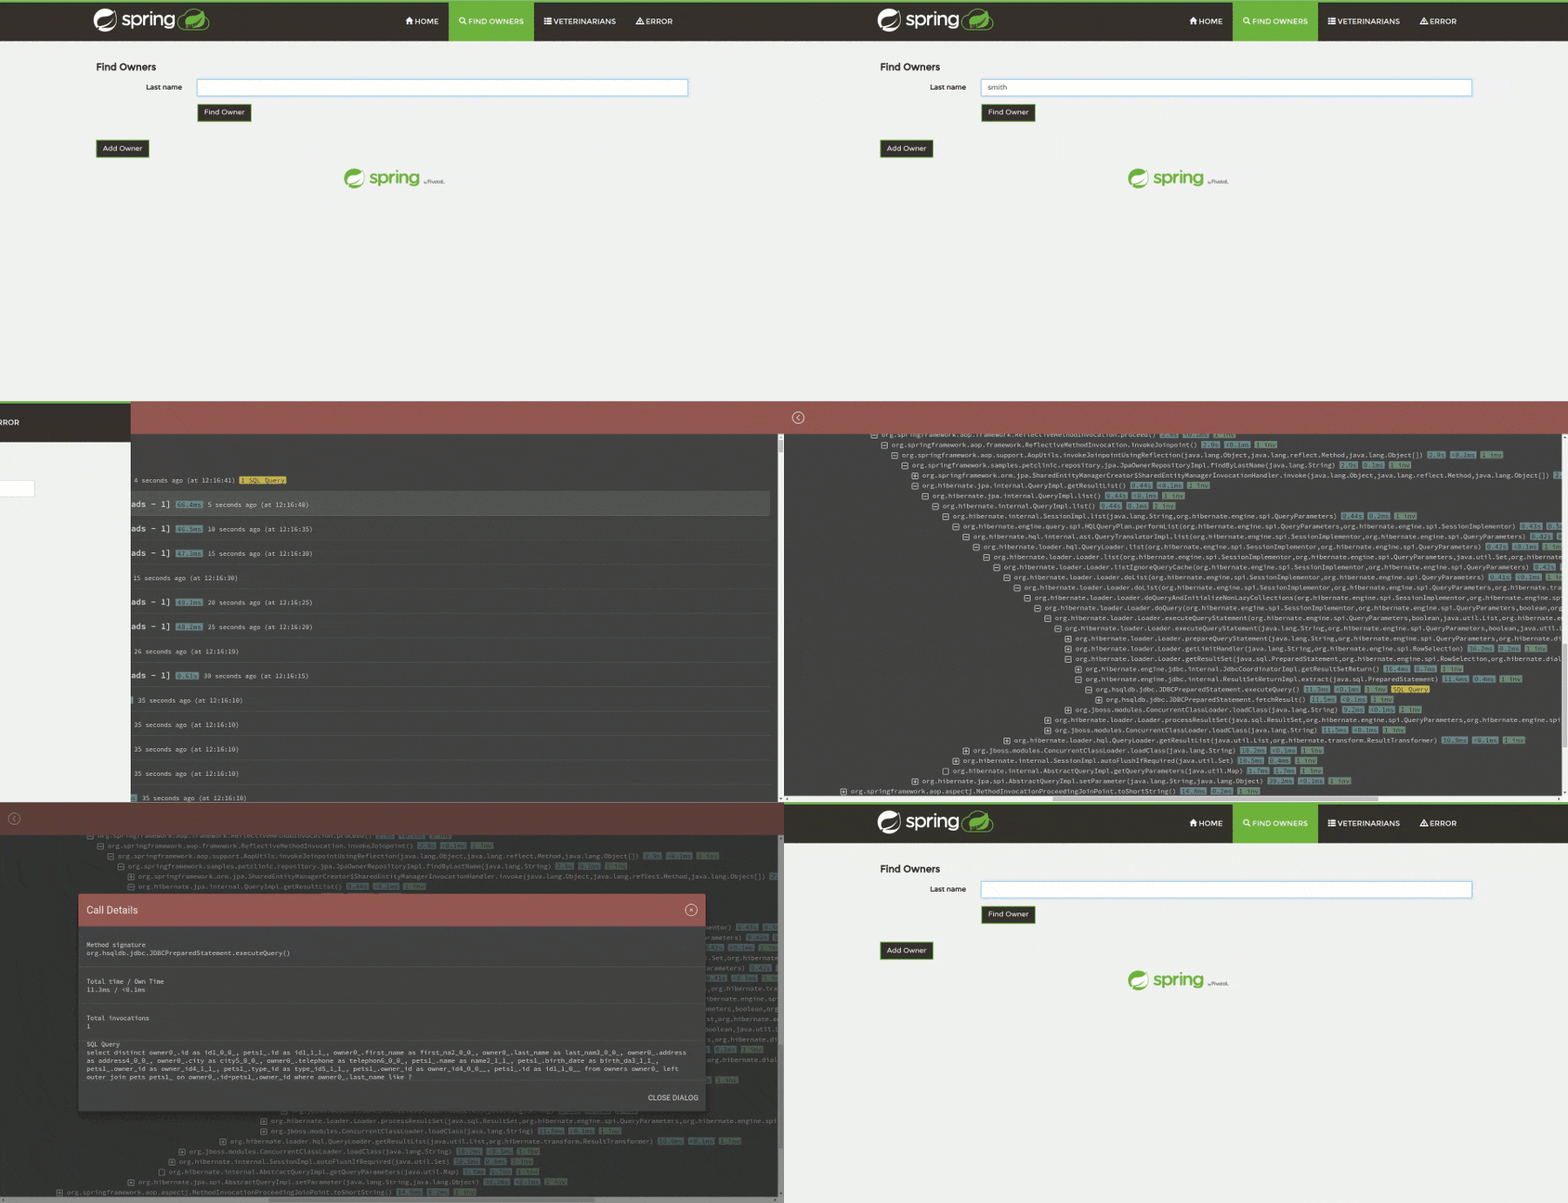
Hoopoe is a java agent deployed to JVM of profiled application. It instruments the code to trace its execution. It supports plugins and extensions. Out-of-the-box we have a plugin to track SQL queries and extension to provide Web-UI. Hoopoe is not a standalone application. Every profiled java process will bring new hoopoe instance up.
Where are we now?
Currently we are in alpha-version. This means two things: firstly, the absolute minimum set of features is developed and is under active real-life testing; secondly, early adopters are welcome as well as any constructive critics and contributions. Our roadmap explains the plans of future development.
Requirements
The only requirement is Java 8.
Installation
-
Download the latest release.
-
Register the agent for your application:
-javaagent:<path-to-hoopoe-agent.jar>-
If you are using JBoss servers (AS, WildFly, EAP), please check additional instructions.
-
-
Start the application.
-
The web-ui for hoopoe-profiler is deployed at http://localhost:9786/.
Hoopoe can be configured in a flexible manner. Please check our Configuration Guide for more details.
|
Note
|
We instrument a lot of code to give the best profiling results we can. It means the time to load any class will increase, as well as the total startup time of the application. |
Full list of features
-
Code execution tracking
-
SQL queries tracking
-
Web-UI to display profiling results
-
Hot Spots calculation and display in Web-UI
-
More to come soon!
Credits
We want to thank the community for all the pieces of code we use. Special thanks to Rafael Winterhalter and his amazing Byte Buddy, which makes java code instrumentation a lot much easier and pleasurable.